Beyond the Numbers: How Sustainability Indicators Help Shape Canada’s Future

In this piece, Vincent Klassen argues that Canada’s environmental progress depends less on lofty commitments than on rigorous, transparent measurement. Marking 20 years of the Canadian Environmental Sustainability Indicators, the article shows how credible data has helped Canada track cleaner air, slowing emissions, stressed ecosystems, and emerging gains in water and waste management. The core claim is simple but consequential: sustainability becomes achievable when it is measurable, publicly visible, and used to guide decisions—turning evidence into accountability and long-term resilience.
Measuring What Matters
Data is the oxygen of good policy — and the compass that guides us toward a sustainable future. Every day, across the Government of Canada, dedicated experts collect, interpret, and publish the data that helps us understand how our choices affect the air we breathe, the water we drink, and the ecosystems we depend on.
The 2022–2026 Federal Sustainable Development Strategy (FSDS) was a 2025 Clean50 Project winner. Its Progress Report, tabled in Parliament in December, provides a comprehensive assessment of Canada’s progress toward our sustainability goals — from climate action and clean growth to healthy ecosystems and resilient communities. Moreover, the consultation period for the 2026-2029 Strategy has been launched and is open until May 12, 2026.
At the heart of this effort are the Canadian Environmental Sustainability Indicators (CESI) — a trusted source of data that underpins the FSDS and other foundational plans and reports. This year marks CESI’s 20th anniversary, a milestone that highlights how sustained, transparent measurement has helped Canada understand environmental change and guide action.
The CESI program includes over fifty indicators — each one a window on the state of our environment. They help policymakers, researchers, and the public see how policy decisions translate into real-world outcomes. With the help of data visualization and mapping tools, CESI makes it easier than ever to see where Canada is making progress, where challenges remain, and how future actions can make a difference.Cleaner Air
Cleaner Air
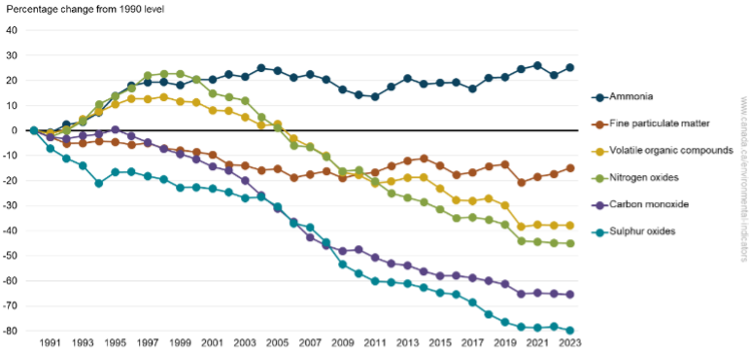
Since 1990, emissions from human activities have decreased for five out of six key air pollutants — a testament to the power of regulation, innovation, and cleaner technologies. These improvements mean fewer smog days and healthier communities.
Air indicators track pollutant releases, air concentrations, and health impacts — helping us understand how policies and consumer choices improve the air Canadians breathe.
Nature Under Pressure
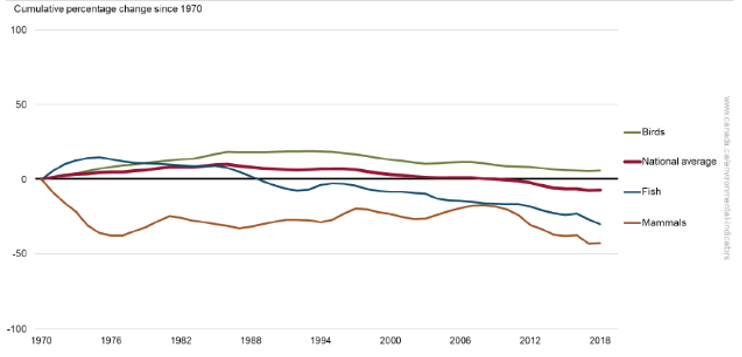
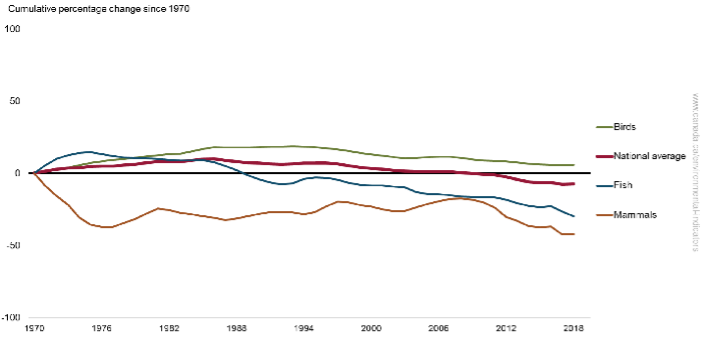
Canada’s monitored vertebrate populations have declined on average by 7% between 1970 and 2018 — with steeper drops for mammals (42%) and fish (30%). Behind these numbers are changing habitats and climate pressures.
Biodiversity indicators help us identify what’s driving these trends and where conservation can have the greatest impact.
Climate Change: Bending the Curve
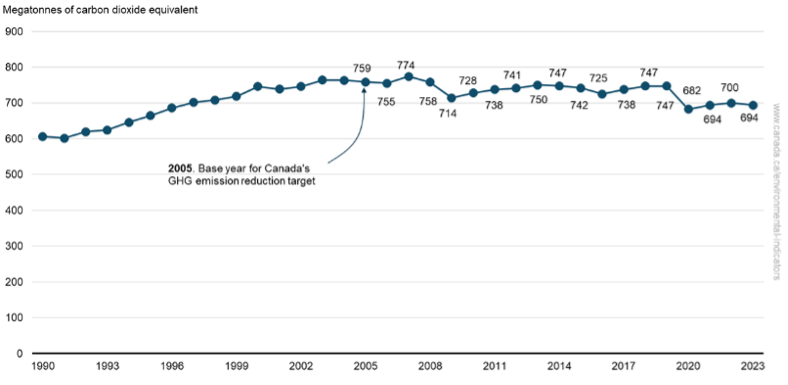
Canada’s greenhouse gas emissions have fallen 8.5% since 2005 — even as the economy and population have grown. This reflects progress in the electricity and heavy industry sectors and shows that decoupling growth from emissions is possible. Climate indicators track emissions, atmospheric concentrations, and temperature trends — keeping us accountable on the path to net-zero.
Water: Canada’s Lifeline
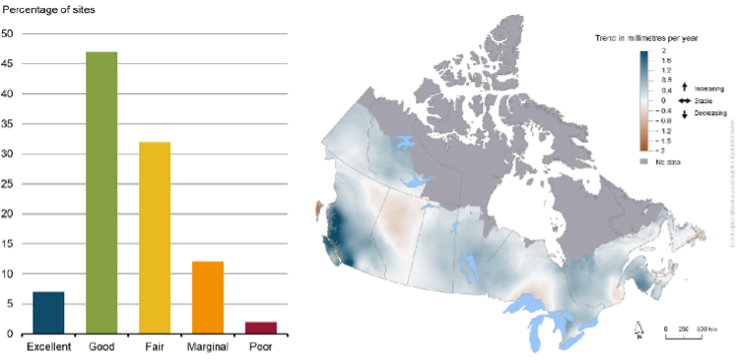
In 2023, river water quality was rated fair to excellent at 83% of monitoring sites. That’s encouraging news for communities and ecosystems across the country.
However, water quantity and flow trends vary regionally, with significant changes in some areas due to shifting precipitation patterns. Water indicators help ensure that this essential resource is monitored and managed wisely as our climate evolves.
Managing Waste, Building a Circular Economy
Waste diversion rates have improved from 22% in 2002 to 27% in 2022, yet more than 70% of solid waste still ends up in landfills.
Waste indicators track how efficiently Canadians use resources — providing the data needed to support a more circular economy where less is wasted and more is reused, generating economic value.
From Data to Decisions
By connecting science, policy, and performance, CESI shows that progress is not abstract — it’s measurable, visible, and achievable when we act on evidence.
Its open data platform, used by over 300,000 Canadians each year, supports policy, research, and public debate on the sustainability issues that matter most.
As we mark 20 years of CESI, the message is clear: what gets measured can be changed. Canada’s environmental story is still being written — and with the right data, we can help shape its next chapter.
“Indicators tell the story of where we’ve been, where we are, and where we need to go. For twenty years, our team has worked to ensure that Canada’s environmental data is reliable, transparent, and relevant to everyone — from policymakers to students. The more people use these indicators, the stronger our collective ability to build a sustainable future.”
— Christian Vézina, Manager, Canadian Environmental Sustainability Indicators Program